As mentioned earlier the most challenging requirement for background rejection is for charge +1 high mass states, since this is where we wish to achieve the highest sensitivity, and where the background rates will be highest. Below we give the results of a Monte Carlo study of the dominant backgrounds for these states.
Our first test of the rejection power of the tracking system design was simply to run
a large number of central Au-Au collisions (62,500) with the spectrometer field set
for the positive strangelet search (+1.5T) and reconstruct all masses for tracks in
the desired velocity range (0.701 ![]() 0.973). This sample included all
interactions in the detectors and air and had shielding hits overlaid as described
above. When this sample was analysed as described above no masses outside the proton
peak were found.
0.973). This sample included all
interactions in the detectors and air and had shielding hits overlaid as described
above. When this sample was analysed as described above no masses outside the proton
peak were found.
In studying this sample of events, we realized that if we loosen the requirements on the first straw tube array (S1) (i.e. do not require a confirming hit in S1) products from interactions in S1, S2, or the vacuum window could sometimes fake high mass objects. Thus if we could run enough simulated events we would find fake high mass events from interactions in S1, S2, or the vacuum window with a coincidental confirming hit in S1 due to some other track. This means that S1 is a possible single point failure for the tracking system. To study this background further we generated a sample of events in which we kept only those events with an interaction in a particular detector component. To further ``distill'' the sample we also required that the interaction send a charged track through the rest of the apparatus. This is precisely the process which, combined with a coincidental hit in S1, can fake a high mass track.
We note that to produce a fake high mass candidate the track must still have reasonable properties - it must point back to the interaction vertex vertically and in time, and must give a velocity in the desired range. Also, for all of these processes the track must point to a valid shower in the calorimeter having the correct position, time and energy. As discussed above, the calorimeter analysis is treated separately, leading to a background rejection factor which is independent of the rejection of the tracking system.
Table ![]() summarizes the results of analyzing central events with
interactions in S1, S2, and the vacuum window (125,000 each). The
simulation included all GEANT physics processes, and the events have shielding hits
overlaid. The first four rows in the table list the materials and thicknesses used
for the three sources of interactions. The next row gives the fraction of all
central interactions which produced a secondary interaction in the specified
detector. The next row lists the fraction of these secondary interactions that gave
a charged track which made it all the way to the calorimeter. Next we give the
number of events generated (125,000 for each source) which, when divided by the two
fractions above, gives the number of central interactions required to produce these
events. Finally, since the central interactions represent about 10% of the total
interaction cross section, we give the total number of interactions required to
produce these events. We then list the number of high mass candidates (mass
summarizes the results of analyzing central events with
interactions in S1, S2, and the vacuum window (125,000 each). The
simulation included all GEANT physics processes, and the events have shielding hits
overlaid. The first four rows in the table list the materials and thicknesses used
for the three sources of interactions. The next row gives the fraction of all
central interactions which produced a secondary interaction in the specified
detector. The next row lists the fraction of these secondary interactions that gave
a charged track which made it all the way to the calorimeter. Next we give the
number of events generated (125,000 for each source) which, when divided by the two
fractions above, gives the number of central interactions required to produce these
events. Finally, since the central interactions represent about 10% of the total
interaction cross section, we give the total number of interactions required to
produce these events. We then list the number of high mass candidates (mass
![]() 10 GeV/c
10 GeV/c ![]() ) found. This allows the tracking system rejection for background
from these sources to be computed. As shown in the last two rows of the table,
to achieve a rejection of <9.7x
) found. This allows the tracking system rejection for background
from these sources to be computed. As shown in the last two rows of the table,
to achieve a rejection of <9.7x ![]() , or one fake candidate per
, or one fake candidate per ![]() interactions requires a rejection of 1/20000 for the calorimeter. The analysis
given below in the section on the calorimeter analysis for charged particles indicates
that for masses greater than 7.5 GeV/c
interactions requires a rejection of 1/20000 for the calorimeter. The analysis
given below in the section on the calorimeter analysis for charged particles indicates
that for masses greater than 7.5 GeV/c ![]() a rejection of 1/72000 should be
possible for the calorimeter we propose.
a rejection of 1/72000 should be
possible for the calorimeter we propose.
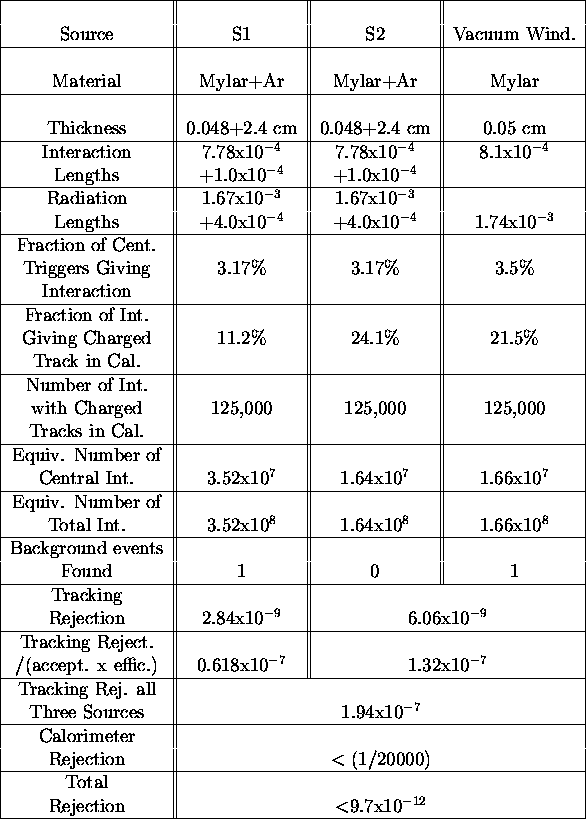
Table: Summary of Background Due to Interactions in S1, S2 and Vacuum Window
Figure ![]() shows the mass spectrum for all late tracks reconstructed
in the above analysis. Note again that every event in this analysis was forced
shows the mass spectrum for all late tracks reconstructed
in the above analysis. Note again that every event in this analysis was forced
Figure: Mass spectrum for all late tracks reconstructed in the background analysis. Every
event was forced to have an interaction in S1, S2 or the vacuum window which sent a charged
particle through the rest of the apparatus.
to have an interaction in S1, S2, or the vacuum window which sent a charged particle
through the rest of the apparatus, so that for background analysis this sample
represents ![]() interactions. For the analysis above we have somewhat
arbitrarily put a lower mass cutoff of 10 GeV/c
interactions. For the analysis above we have somewhat
arbitrarily put a lower mass cutoff of 10 GeV/c ![]() . Looking at the mass spectrum,
however, one can see that even going as low as 3 GeV/c
. Looking at the mass spectrum,
however, one can see that even going as low as 3 GeV/c ![]() would not more than
double the background.
would not more than
double the background.
We should note that even though the simulations described above indicate that the apparatus has the desired rejection, there are a number of possible improvements which can be implemented within the scope of the present design. One possible improvement in tracking is to have some track vector information between the two spectrometer magnets. This could be accomplished without adding any more channels simply by longitudinally separating the three coordinates of S1. Another improvement in the tracking analysis is to reject hits in S1 as confirming hits for high mass candidates if the hits are shared with another track. We believe improvements in the calorimeter shower algorithm are also possible and we will study this further using the output of the GEANT calorimeter simulation discussed below.
We illustrate the possible tracking improvements by showing one of
the events from our simulation. This event has a
candidate which was rejected as ambiguous with a proton that did not come
from the target. Figure ![]() shows a plan view of the hits
in the detectors. The beam is from the left and the target and first
magnet are off the page to the left. The scale at the bottom shows the
distance from the target in meters. Only the useful field volume of
the second magnet and the actual hits in the detectors are shown.
Figure
shows a plan view of the hits
in the detectors. The beam is from the left and the target and first
magnet are off the page to the left. The scale at the bottom shows the
distance from the target in meters. Only the useful field volume of
the second magnet and the actual hits in the detectors are shown.
Figure ![]() shows the same event with the downstream track segments
found by the analysis program. One track as indicated passes the
velocity cut to be considered a late track (
shows the same event with the downstream track segments
found by the analysis program. One track as indicated passes the
velocity cut to be considered a late track ( ![]() ).
Figure
).
Figure ![]() shows the event with all tracks projected upstream to S1.
The reconstructed mass for the late track using the downstream track segment
is shown. Figure
shows the event with all tracks projected upstream to S1.
The reconstructed mass for the late track using the downstream track segment
is shown. Figure ![]() shows an
expanded view of the tracks at S1 with the late track indicated.
The late track matches well with one of the hits in S1. (It also matches
well in the other views.) This particular hit is shared with another
track so that the late track would be rejected by the improvement
suggested above. Figure
shows an
expanded view of the tracks at S1 with the late track indicated.
The late track matches well with one of the hits in S1. (It also matches
well in the other views.) This particular hit is shared with another
track so that the late track would be rejected by the improvement
suggested above. Figure ![]() shows the projection of
the late track using the measured time of flight but assuming a mass of
0.938 GeV/c
shows the projection of
the late track using the measured time of flight but assuming a mass of
0.938 GeV/c ![]() . This assumption gives a projection which also matches
a hit in S1 (in both views). Thus, this candidate is rejected
as ambiguous.
. This assumption gives a projection which also matches
a hit in S1 (in both views). Thus, this candidate is rejected
as ambiguous.
Figure: Plan view of Monte Carlo Event. Only active volume of second
magnet and hits in detectors are shown. Scale shows distance to target in meters.
Figure: Monte Carlo event with reconstructed downstream track segments.
Late track is indicated.
Figure: Monte Carlo event with track segments projected upstream through
second magnet. Reconstructed mass is shown for late track.
Figure: Expanded view of Monte Carlo event at first straw tube array (S1).
Late track is indicated.
Figure: Monte Carlo event at S1 with late track projection assuming proton
mass.